
Born on July 26, 1842, Alfred Marshall gave us the modern language of price theory: supply, demand, elasticity, surplus.
Marshall’s famous “scissors” model—where prices emerge from the intersection of supply and demand—became the foundation of microeconomics.
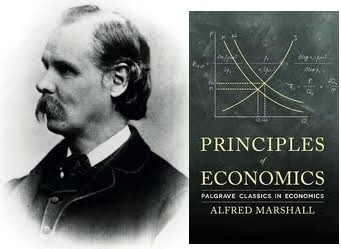
If you look at the graph you will see a curve rising from the bottom left. This maps the quantity of goods or services that will be put on the market at any given price point (S stands for Supply). When prices are low (on the y axis) there is not a lot of supply (producers can’t affords to make it perhaps). When prices are high then lots of people want to get into the industry and supply increases.
The other curve starts at the top right and slopes down. When prices are high there is not a lot of demand but as prices get lower more and more people enter the market to buy. If things were really cheap many people would want to buy -which is why sales are so effective. That is the Demand curve.
If there are lots of people who want to buy because something seems cheap, but there is not a lot of goods available to be sold, then suppliers will soon run out. By putting the price up they can ration the supply to those who really want to buy their goods. It helps that their profits will also rise. The number of people wanting to buy will drop off and eventually there will be a meeting price where the number who want to buy is the same as the number who want to sell.
If the suppliers increase their prices too much then not enough people will demand the goods. The suppliers will have to cut the price to sell more. The price will drop down to that meeting price where demand and supply curves cross over. This the price at which the quantity of the goods on the market is the same as the quantity demanded by buyers.
Marshall called this meeting point equilibrium. It is where the two curves meet.
If anyone mentions “Economics 101” they quite often are meaning this work of Marshall’s (whether they know it or not).
It wasn’t perfect. He didn’t quite understand how the supply side worked. However we economists owe him a lot in beginning to understand how economic behaviour influences prices. His model explains what should happen if a tariff is negotiated, or if GST is added but that is a more complicated lesson for another day (clue: the third curve on the graph helps out).